Poverty Lane / Systems Map

Find Livable Income Bounds

This map frames poverty as a system, not just a low-income status: income pressure, fixed costs, instability, and access friction combine over time. The target is durable livable life, not a temporary income bump.

Poverty bounds Five barriers Intervention layers AGI before robotics
A full poverty-system infographic covering poverty bounds, core barriers, intervention layers, AGI fit before and after robotics, and the lag between AGI capability growth and poverty relief.
System map: poverty pressure vs livable life, with a timeline showing that capability gains can come before broad poverty relief.

How to Read This

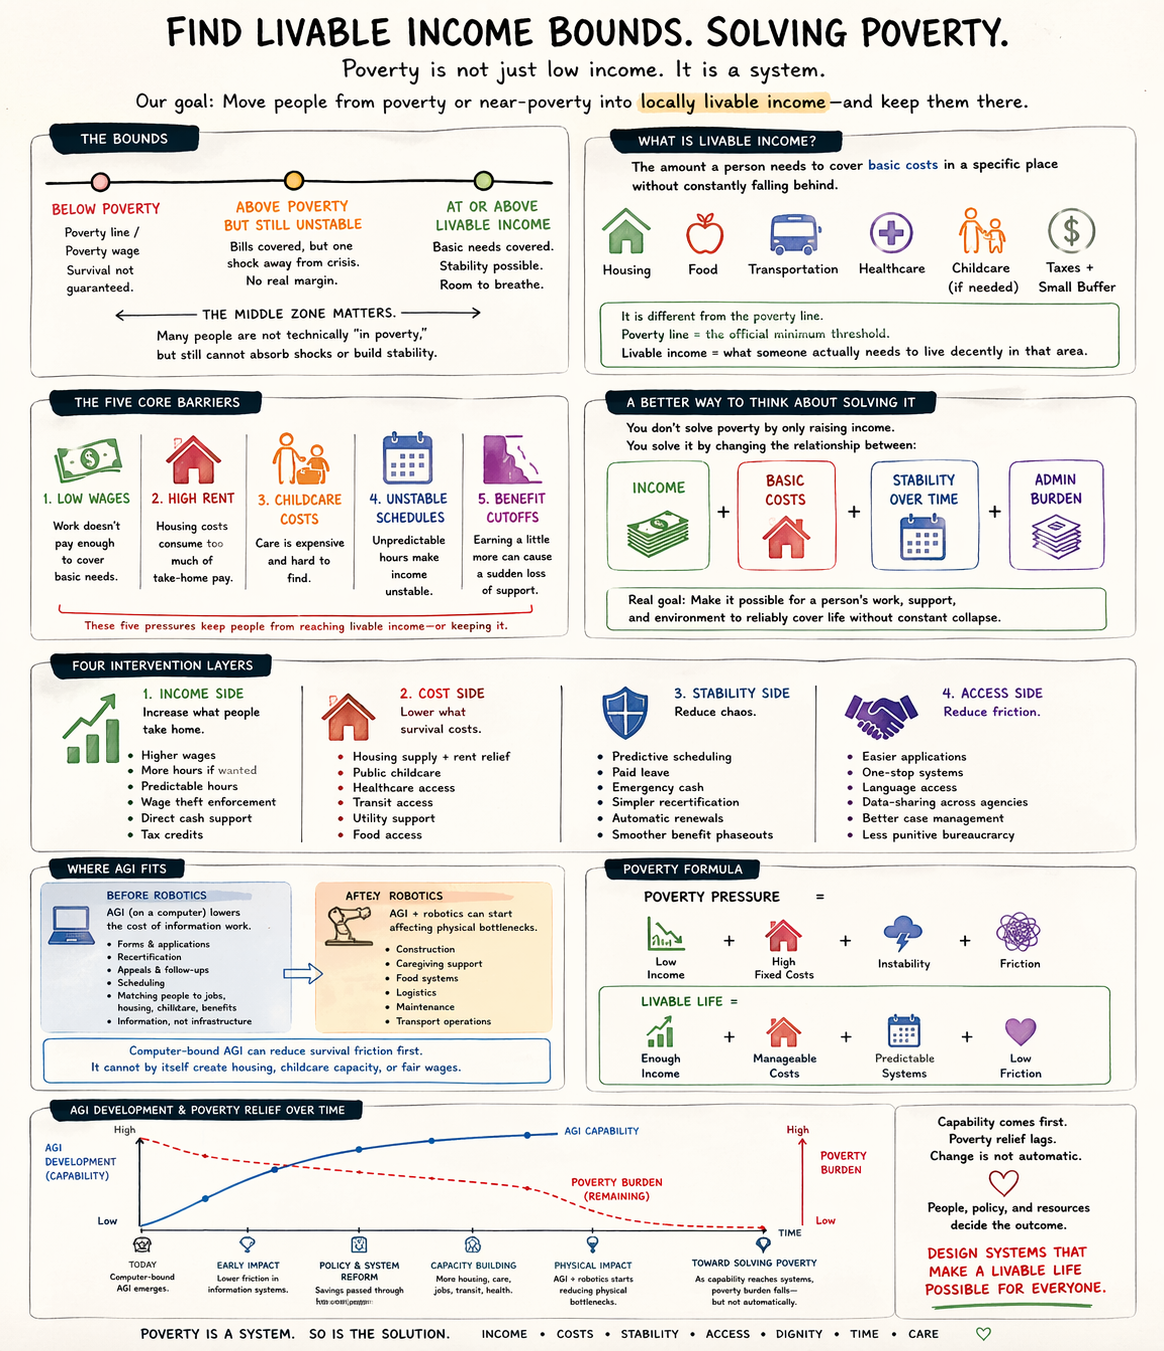
The center of the map is the unstable middle zone: people can sit above the official poverty line but still remain one shock away from crisis. The intervention model is built to close that gap.

  1. Income Side: Raise take-home stability through wages, predictable hours, and direct cash supports.
  2. Cost Side: Lower survival costs such as rent burden, childcare pressure, transportation, and utilities.
  3. Stability Side: Reduce month-to-month shocks with predictable scheduling, paid leave, emergency support, and smoother benefit transitions.
  4. Access Side: Remove bureaucracy friction through simpler applications, language access, and better case-management flows.

Route Placement

This is the poverty-lane home for the map. It still stays linked from AGI because the chart explicitly separates computer-bound AGI effects from later robotics effects.

  • Newark Poverty Overview - The broader poverty lane with housing, market, and museum pressure tabs.
  • AGI Monitor - Capability timeline and bottleneck view; this map is cross-linked there.
  • Bread-Pressure Tracker - Tracks whether relief systems are actually forming under automation pressure.